METEOINFO 官网
脚本汇总贴
使用到的
利用MeteoInfo中TrajStat插件做条件轨迹聚类分析
未解决问题
待学习
trajstat做PSCF分析时按步骤操作遇到这个问题 PSCF Analysis
metetoinfo 1.5
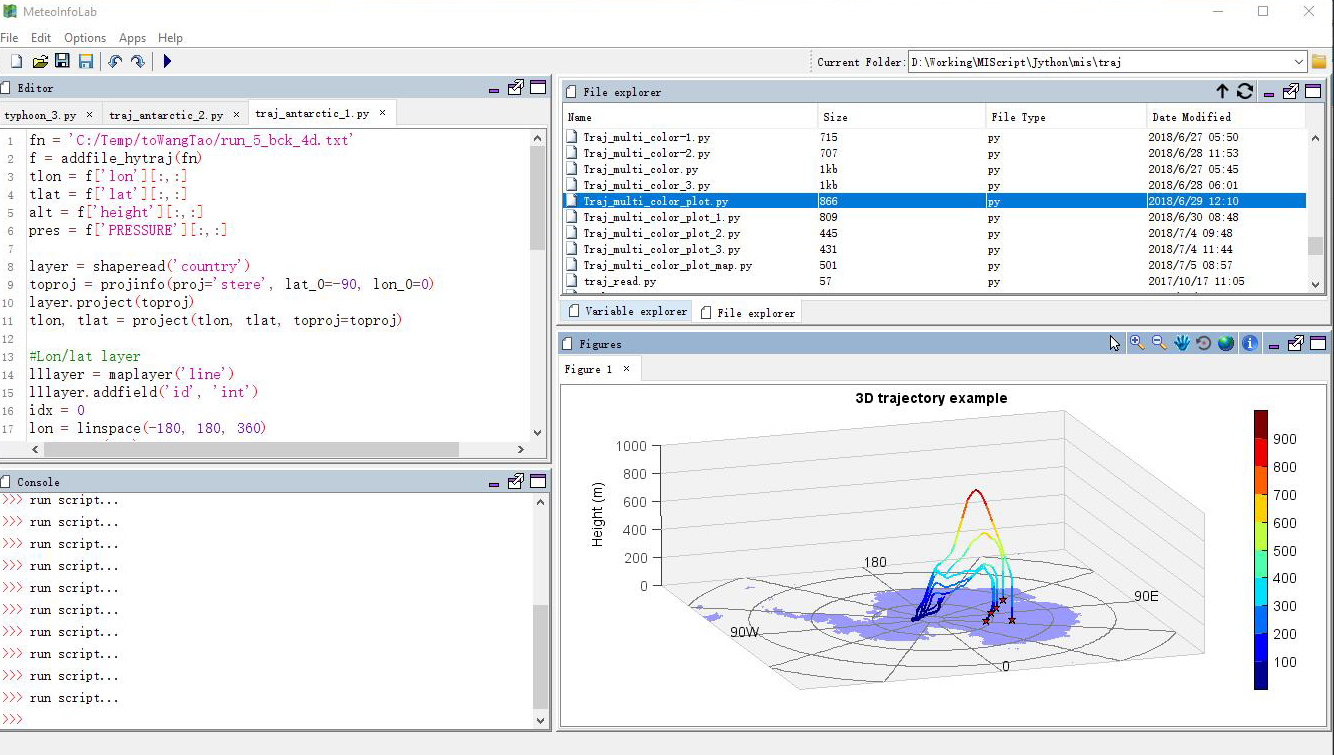
3D stem plot:
z = linspace(0, 1, 100)
x = z * np.sin(20 * z)
y = z * np.cos(20 * z)
c = x + y

#Plot
ax = axes3d()
points, stemlines = ax.stem(x, y, z, c=c, edge=False, samestemcolor=True)
colorbar(stemlines,shrink=0.8)
title('Point 3D plot example')

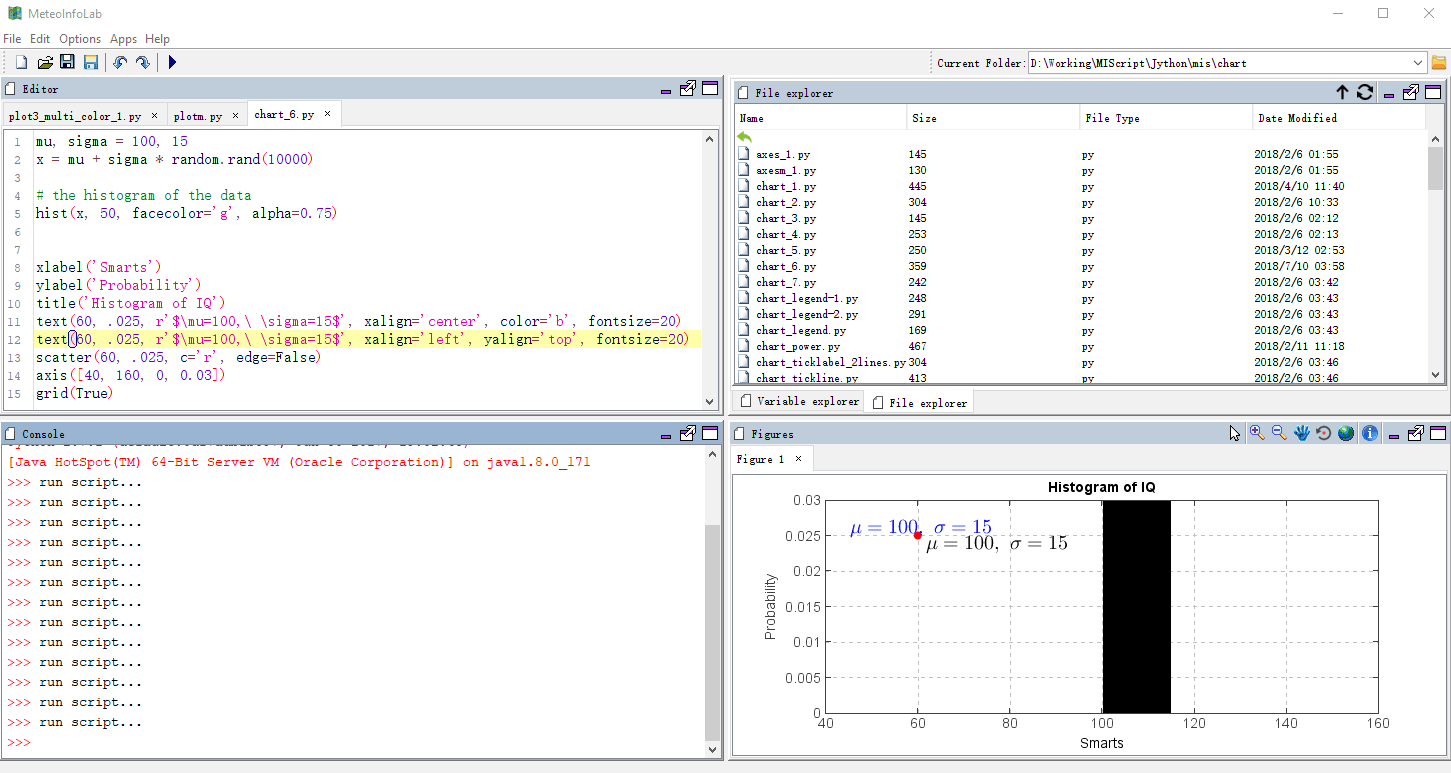
text
plotutil.py
本文由 xigrug 创作,采用 知识共享署名4.0 国际许可协议进行许可
本站文章除注明转载/出处外,均为本站原创或翻译,转载前请务必署名
最后编辑时间为:2018-06-22 10:13:56