python可视化库可以大致分为几类:
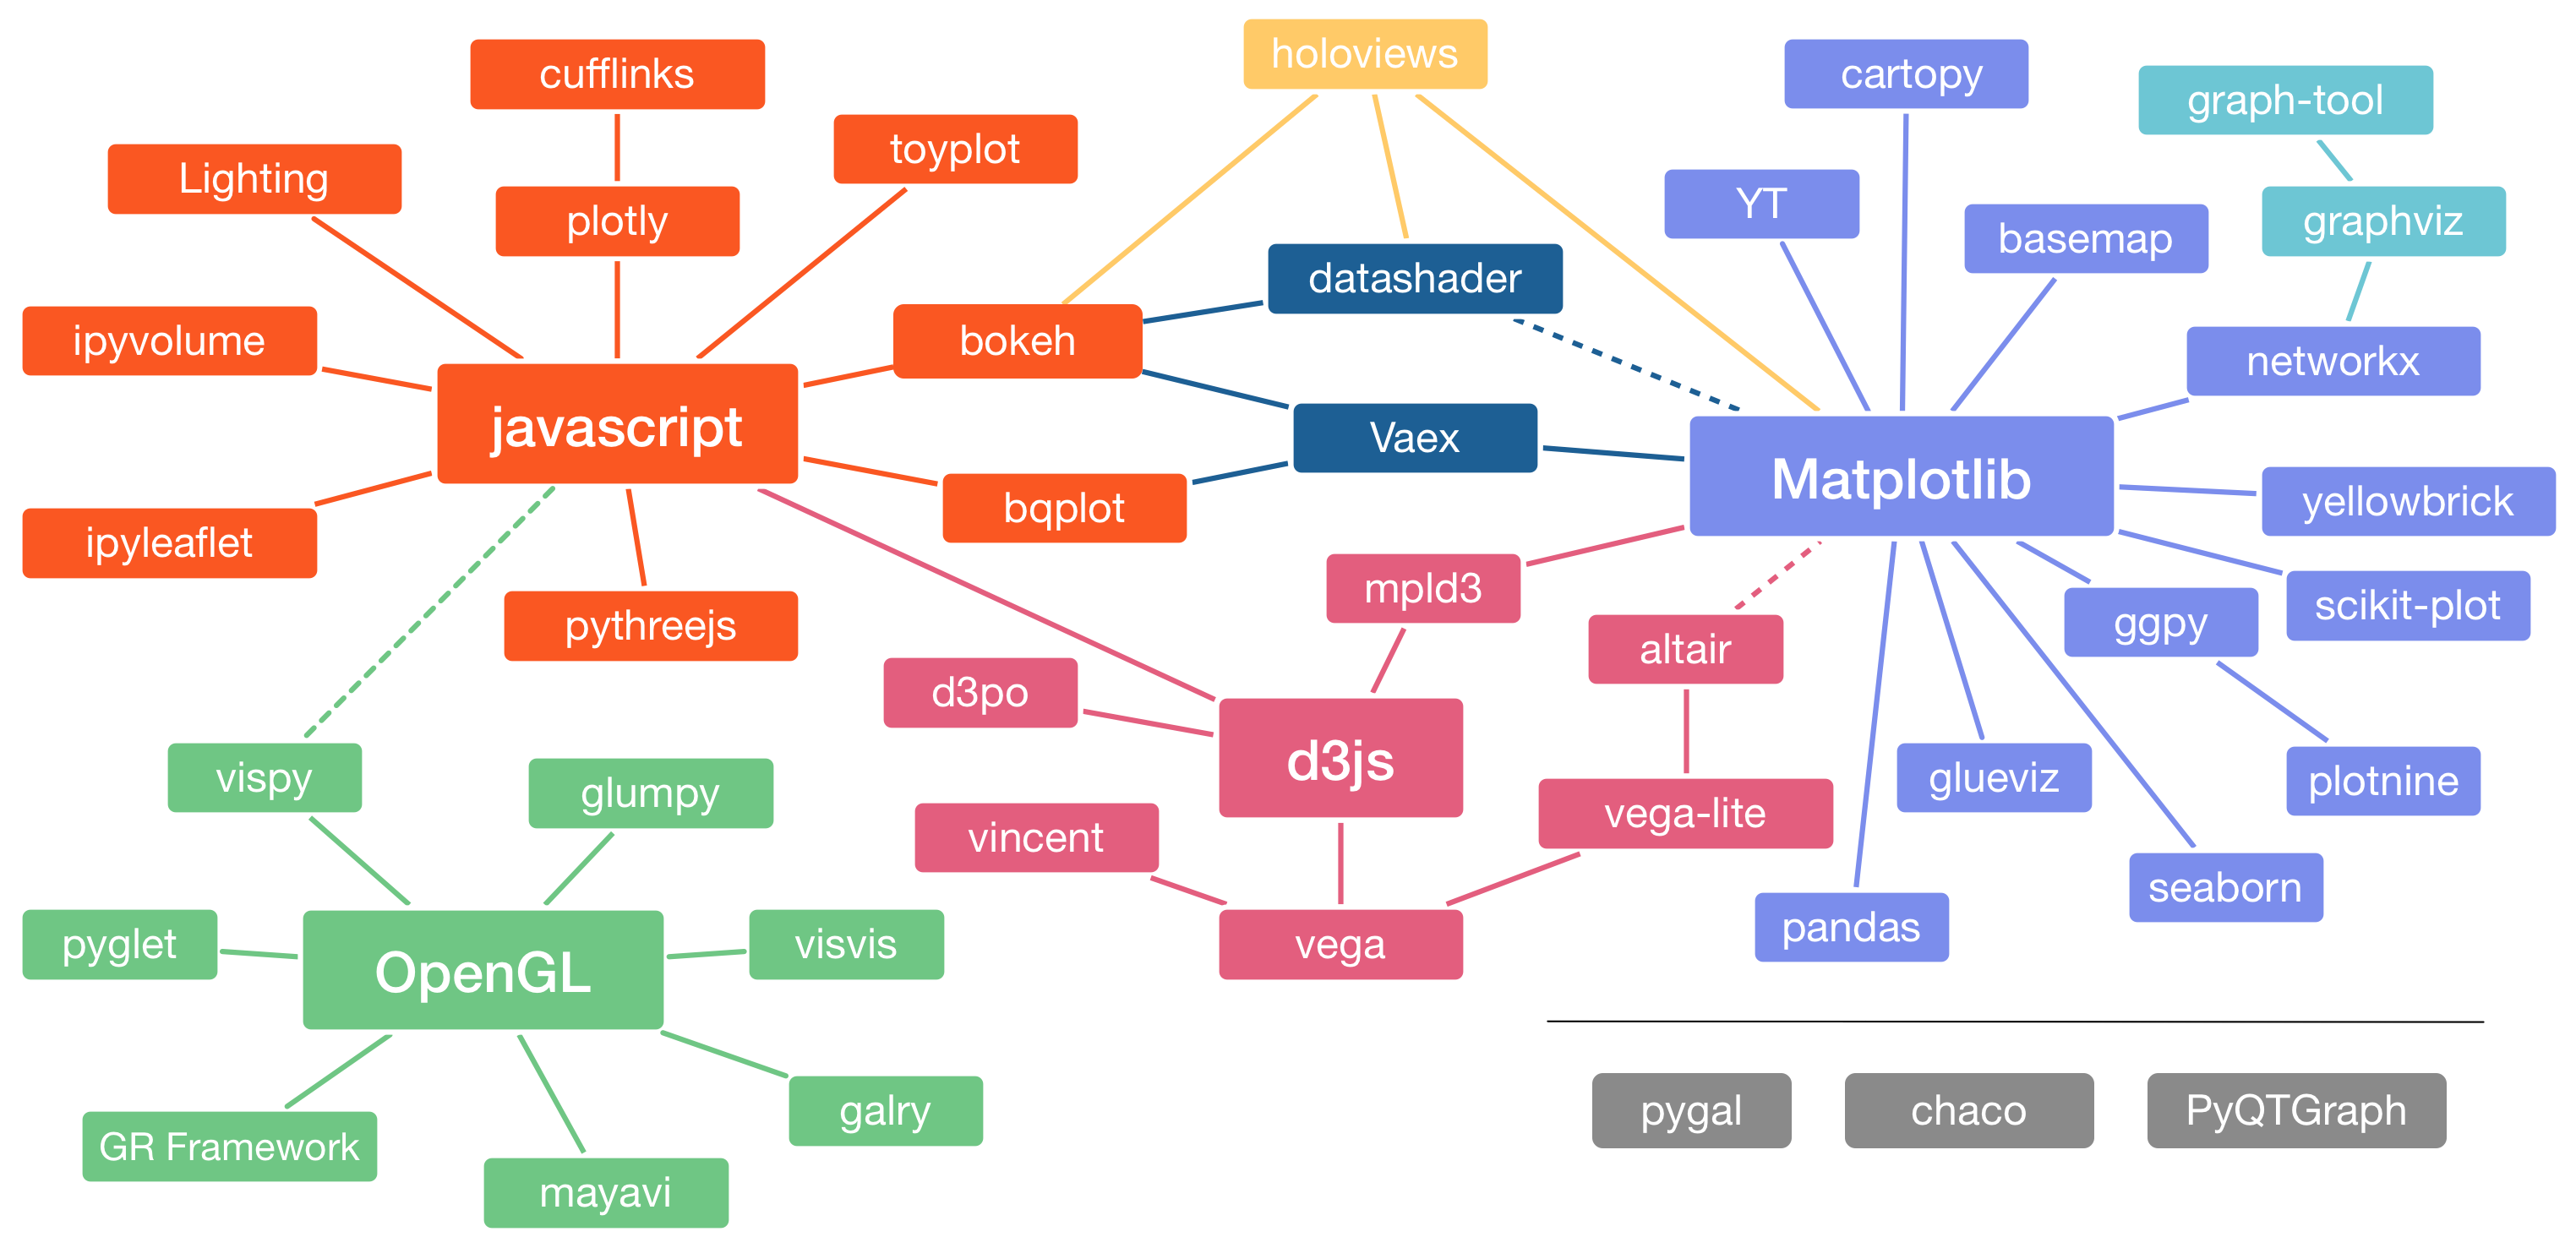
基于matplotlib的可视化库 基于JS的可视化库 基于上述两者或其他组合功能的库
Overview of Python Visualization Tools
Python matplotlib高级绘图详解 可查看绘图框架
Artist的属性
alpha : 透明度,值在0到1之间,0为完全透明,1为完全不透明 animated : 布尔值,在绘制动画效果时使用 axes : 此Artist对象所在的Axes对象,可能为None clip_box : 对象的裁剪框 clip_on : 是否裁剪 clip_path : 裁剪的路径 contains : 判断指定点是否在对象上的函数 figure : 所在的Figure对象,可能为None label : 文本标签 picker : 控制Artist对象选取 transform : 控制偏移旋转 visible : 是否可见 zorder : 控制绘图顺序
速查
unidata Examples of GEMPAK Analysis and Display Capabilities
domain : plot-wrf-domains-in-google-earth
earthpy seaborn PyNGL CATEGORY Basemap
总结
Getting Started with Sphinx-Gallery
A-D
altair : Declarative statistical visualization library for Python

Bokeh is an interactive visualization library that targets modern web browsers for presentation.一个用于做浏览器端交互可视化的库,实现分析师与数据的交互。[^Interactive] ipynb
bqplot is a Grammar of Graphics-based interactive plotting framework for the Jupyter notebook
cartopy cartopy-tutorial jupyter climate06
ccplot: CloudSat, CALIPSO and Aqua MODIS products[^SAT]
CDAT is a powerful and complete front-end to a rich set of visual-data exploration and analysis capabilities well suited for data analysis problems.[^3D]
cis : modis [^SAT]
CHIMPLOT [^MODEL]
D3Py :a plottling library for python, based on D3
datamaps : Customizable SVG map visualizations for the web in a single Javascript file using D3.js [^MAP]
E-H
Echarts : BaiDu [^Interactive]
The Flight Path Tool (FPT) is a comprehensive, interactive, geographical display that brings together all of the weather products available on ADDS. It runs as a desktop application on your computer for maximum performance. [^java]
Geoplotlib is a python toolbox for visualizing geographical data and making maps[^MAP]
gmap : is a plugin for Jupyter for embedding Google Maps in your notebooks. It is designed as a data visualization tool.[^MAP]
gmplotPlotting data on google maps, the easy (stupid) way.[^MAP]
geopandas [^MAP]
Highcharts makes it easy for developers to set up interactive charts in their web pages [^Interactive]
I-L
M-O
Mayavi : 3D scientific data visualization and plotting in Python[^3D]
mapbox[^MAP]
Metpy[^MODEL]
MkMov : make a movie from a NetCDF file or stitch together a series of *.png files. [^MODEL]
mplleaflet [^MAP] SHOW
P
plotly官方教学[^Interactive] ipynb
pyecharts是基于百度echarts的一个开源项目,也是我目前接触到的最容易实现交互可视化的工具,相比bokeh和plotly,pyecharts的语法更简单,实现效果更佳出众。
pygal : sexy python charting
paraview pv_atmos for paraview Cloud-resolving simulation over Germany using ICON HighRes
**plotnine
PyNGL NCL [^MODEL]
PyNCplot for WRF trajectory [^MODEL]
PyWPS is a WPS implementation written in the Python language. The current version is 4.0.0.
pyWRFis designed to read, process, and plot data from the Weather Research and Forecasting model. [^MODEL]
PyGEOMET : Python GUI of Earth Observations and Model Evaluation Toolkit like ncview
Q-S
T-V
VisPy is a high-performance interactive 2D/3D data visualization library leveraging the computational power of modern Graphics Processing Units (GPUs) through the OpenGL library to display very large datasets.
vincent no more updates
VPython: Easy-to-use 3-D visualization and animation environment[^3D]
Vapor-python guide[^3D]
W-Z
WRF-Python [^MODEL] Xarray [^MODEL] —-
others
Color
ColormapTransformations —- [^MAP]: 地图可视化 [^Interactive]: 交互式 [^3D]: 3D [^SAT]: SATELLITE [^MODEL]: MODEL 模式 [^java]: by java —-
output
save-multiple-plots-to-one-pdf-file
'''
Save multiple plots to one pdf file
Many image file formats can only have one image per file, but some formats support multi-page files. Currently only the pdf backend has support for this. To make a multi-page pdf file, first initialize the file:
'''
from matplotlib.backends.backend_pdf import PdfPages
pp = PdfPages('multipage.pdf')
#You can give the PdfPages object to savefig(), but you have to specify the format:
plt.savefig(pp, format='pdf')
#An easier way is to call PdfPages.savefig:
pp.savefig()
#Finally, the multipage pdf object has to be closed:
pp.close()
示例
雷达
T-lnp图绘制.ipynb
地闪定位仪数据处理及绘图部分
雷达反射率及径向速度
TVS及闪电活动演变.ipynb
CINRAD雷达基数据处理
pbpython
Bullet-Graph-Article Visualizing Google Forms Data with Seaborn
cross

Matplotlib axis labels: how to find out where they will be located?
用法
如何在matplotlib中添加条形图标签?
 python clip一定区域 白化
quiver

本文由 xigrug 创作,采用 知识共享署名4.0 国际许可协议进行许可
本站文章除注明转载/出处外,均为本站原创或翻译,转载前请务必署名
最后编辑时间为:2018-06-23 10:13:56